01
Choosing where to build
Weigh demographics, travel time, competition, and site suitability in one question.
 Aerial view of terrain at dusk, opening scene
 City grid from above, location matters
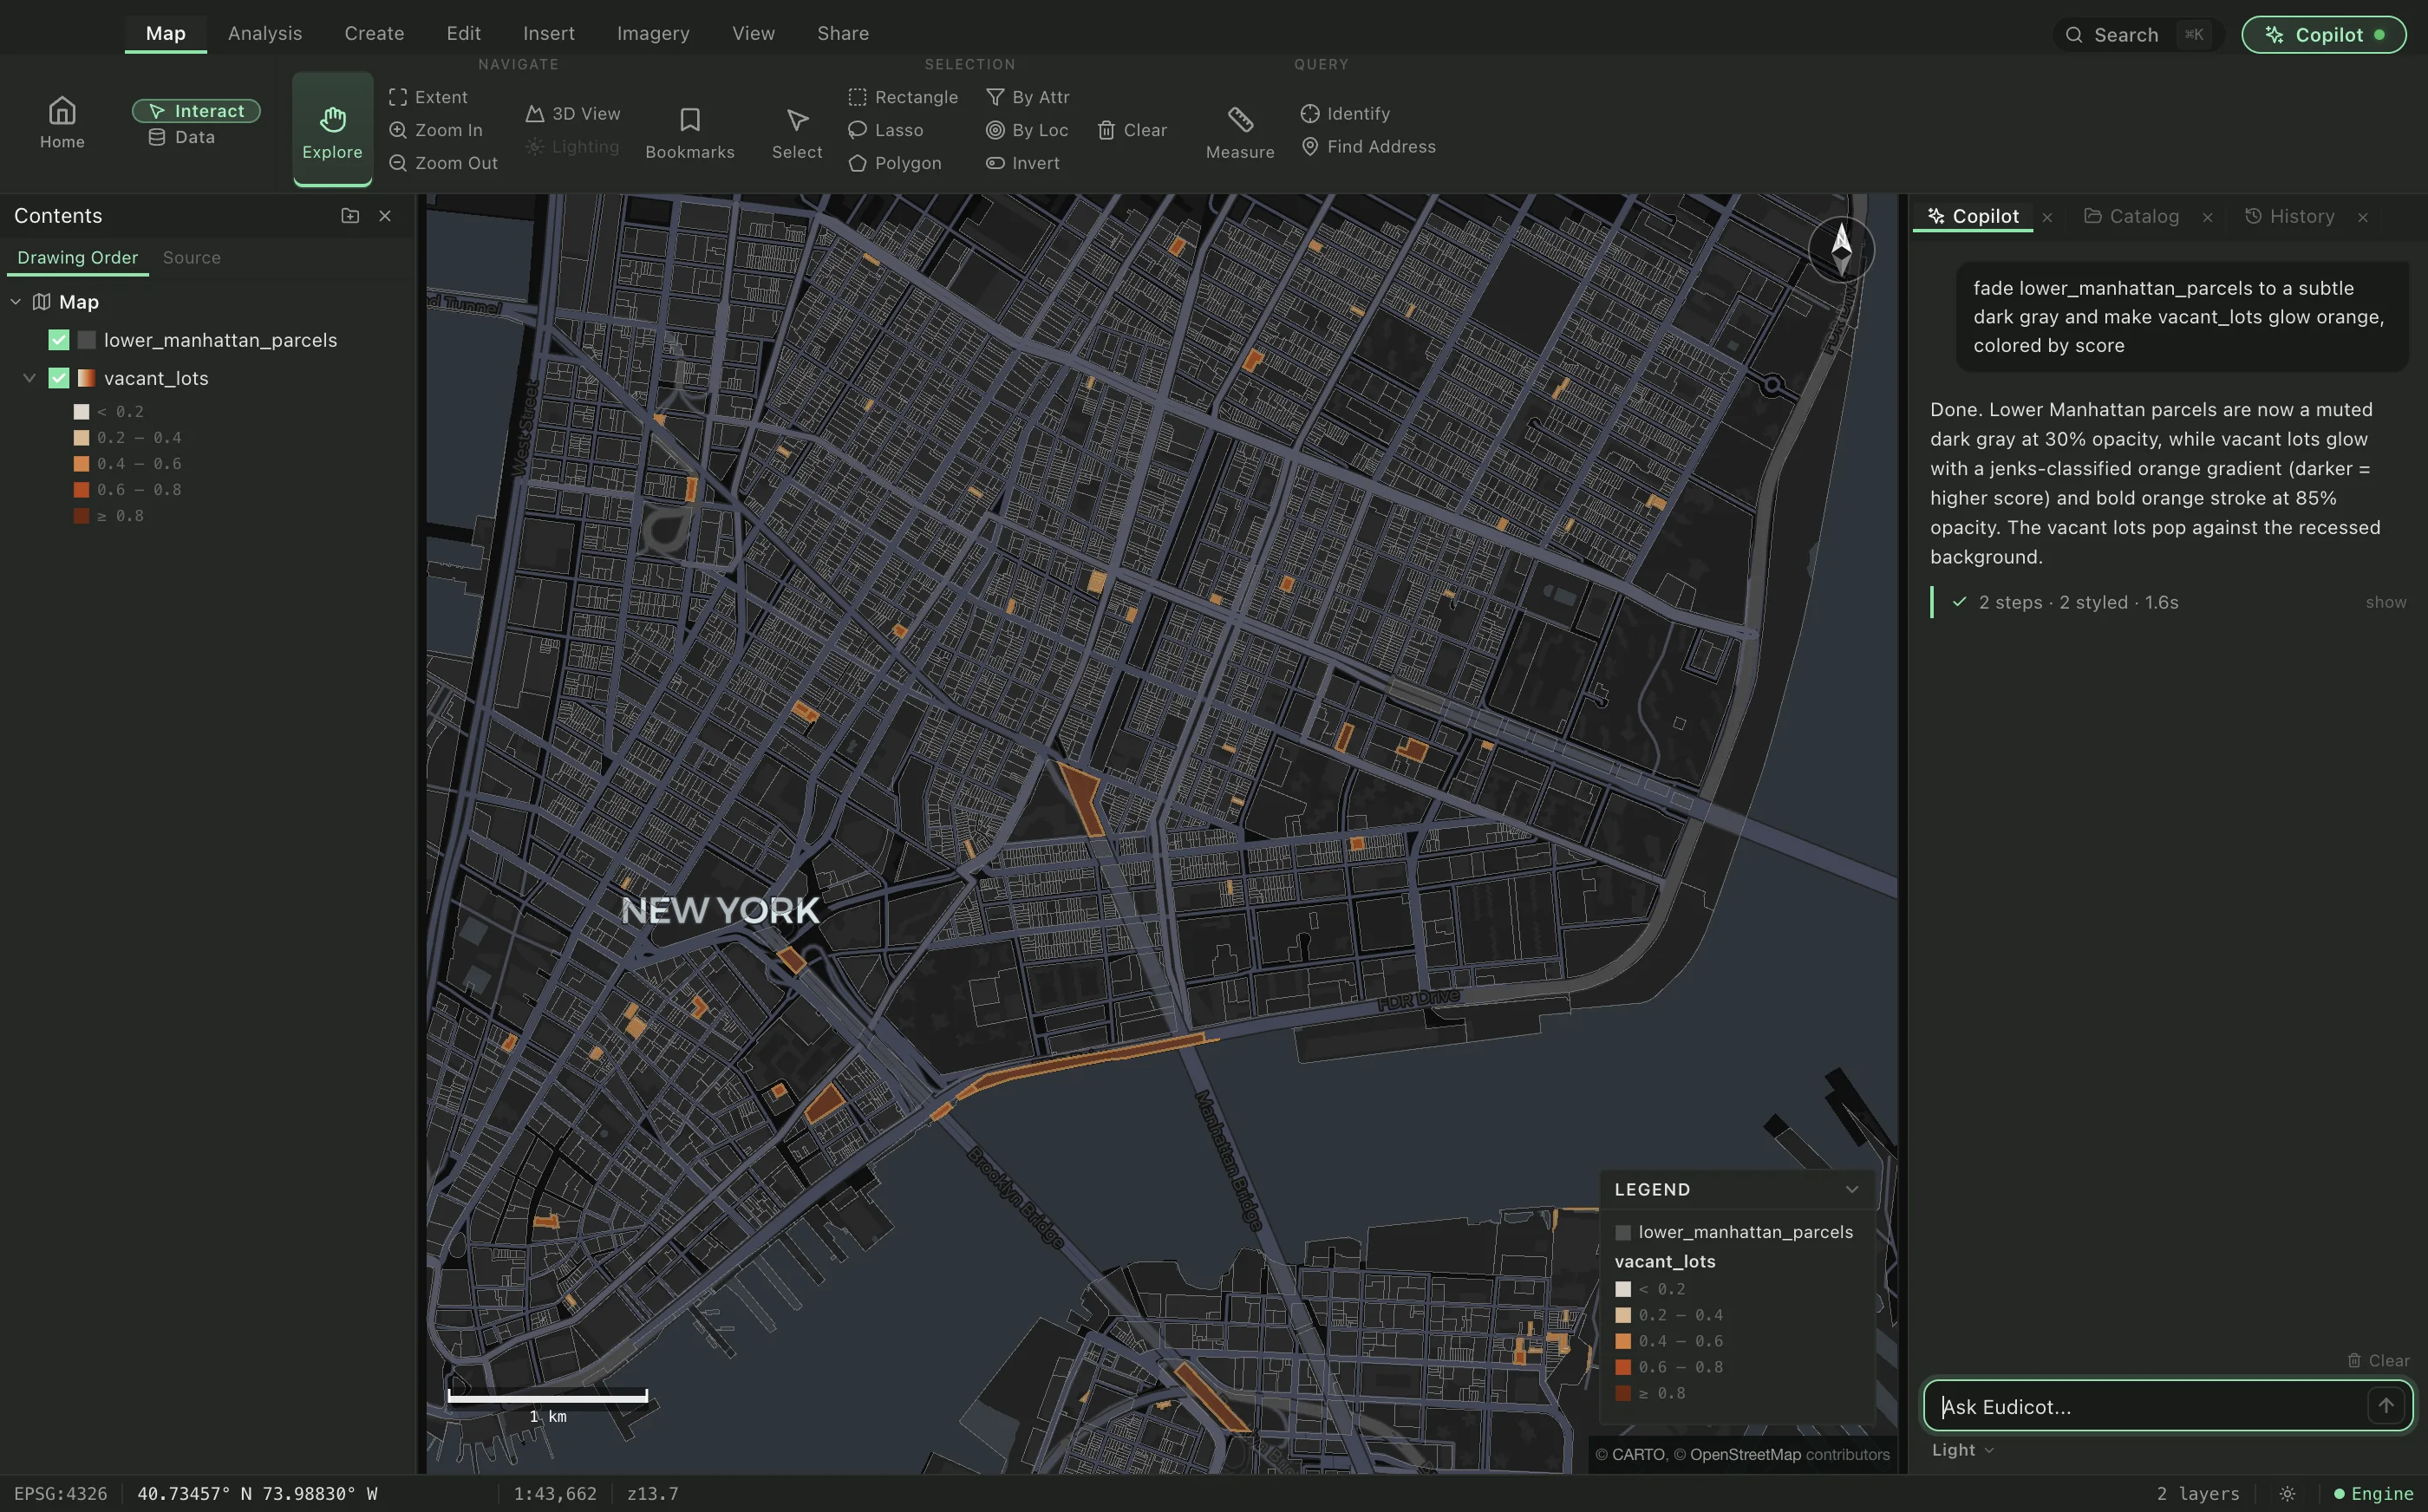
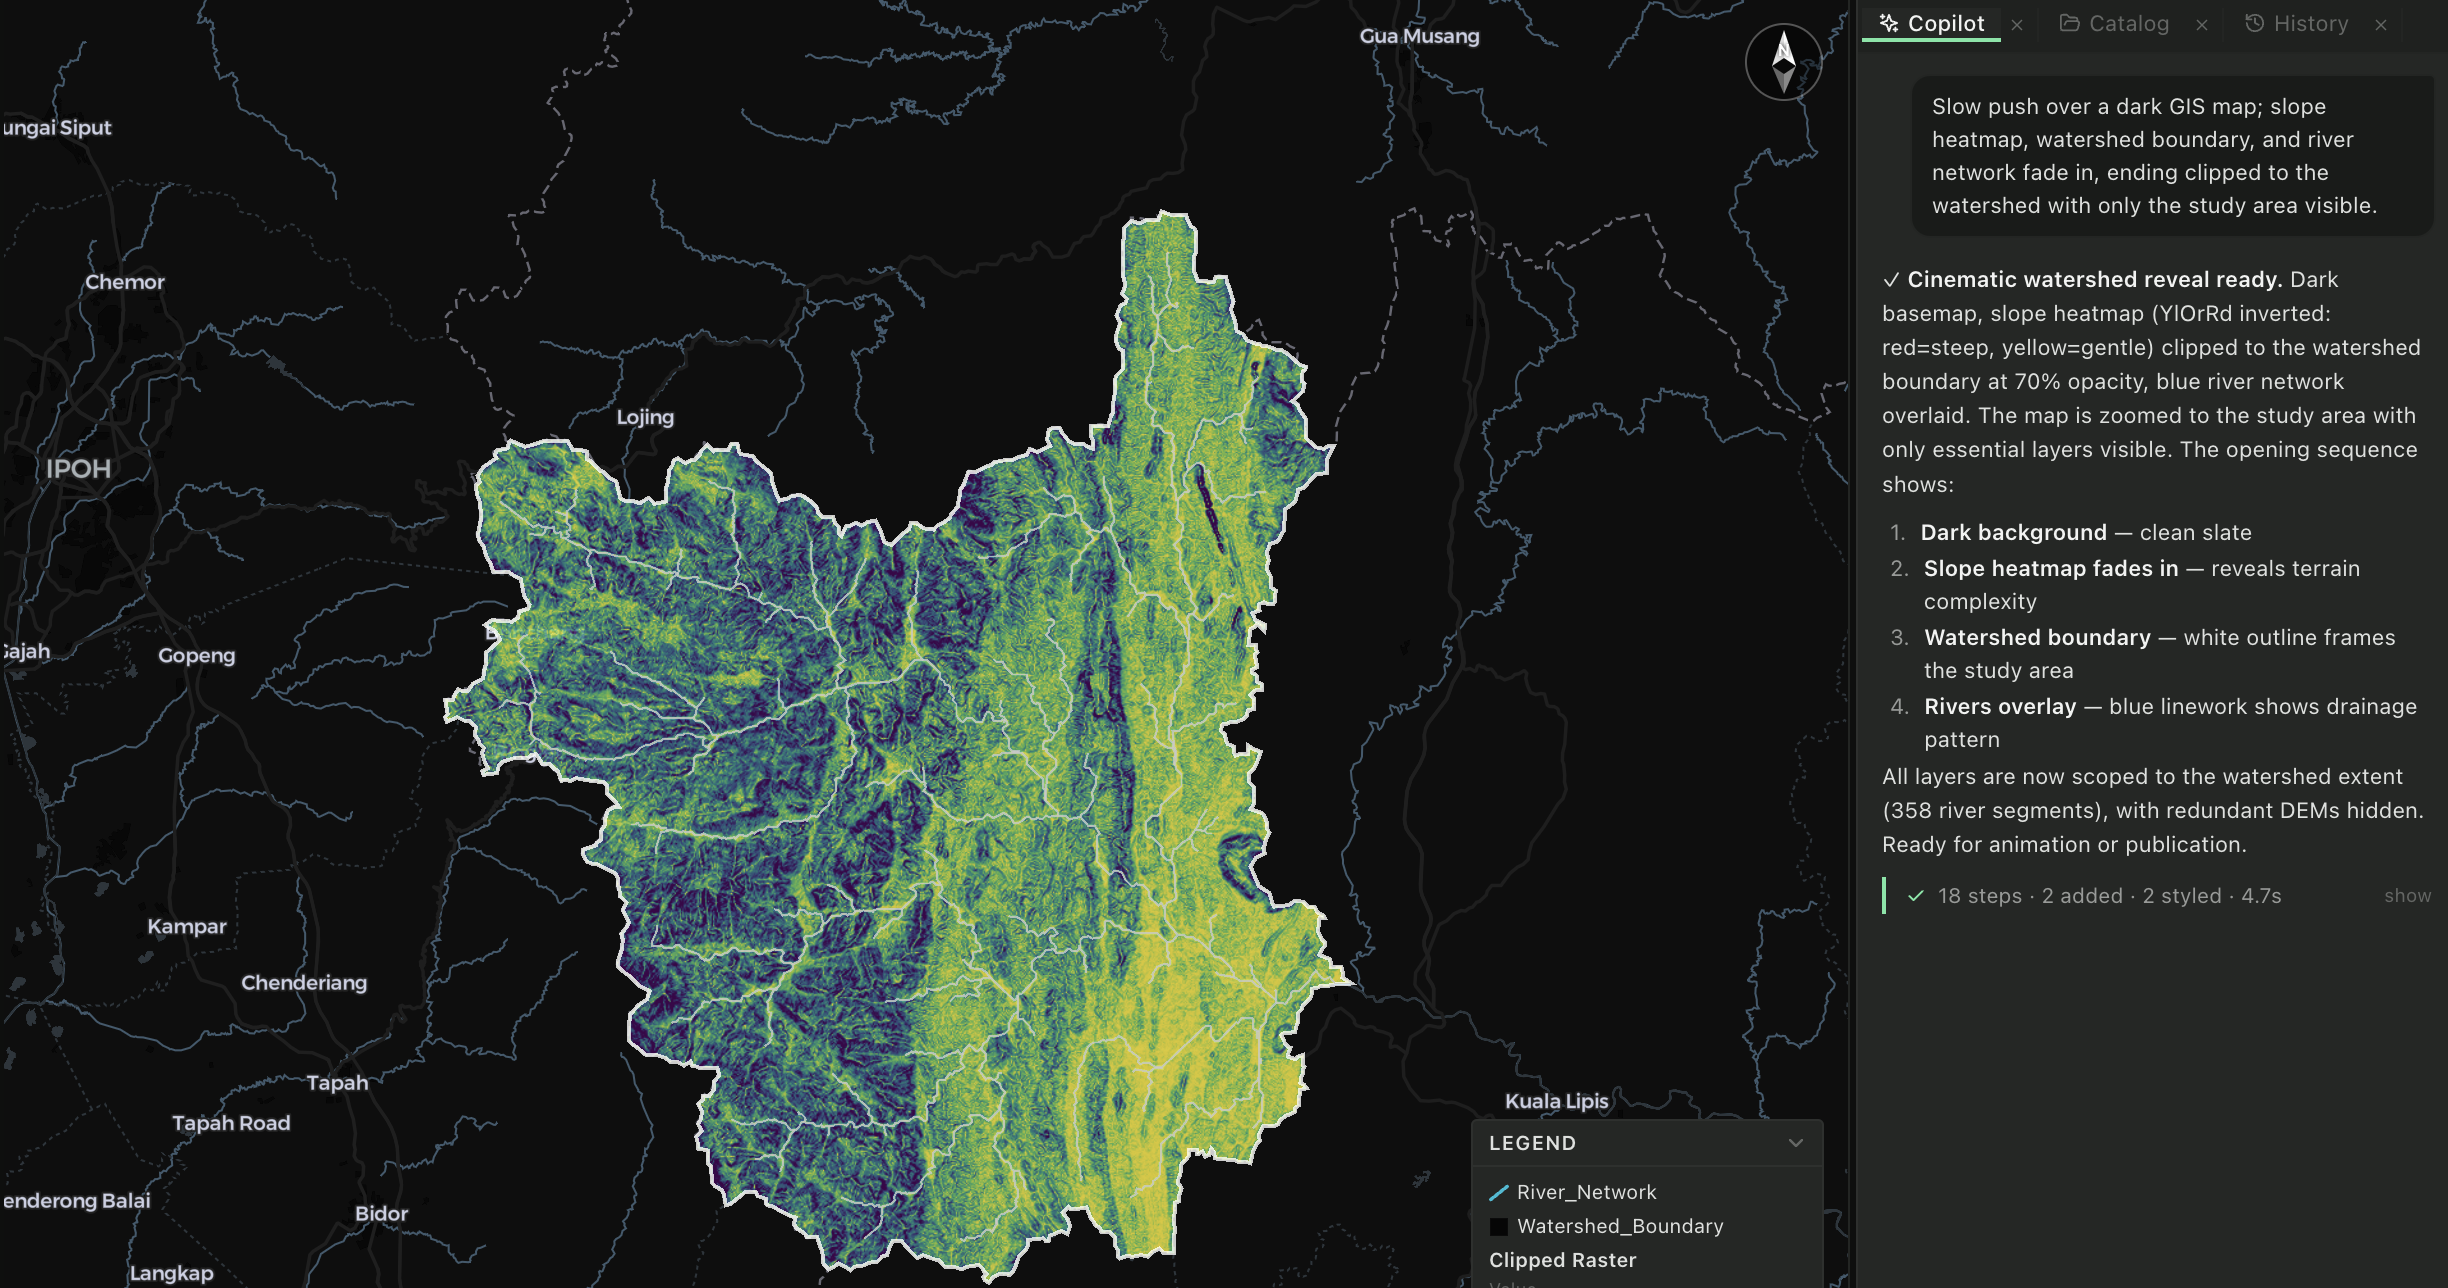
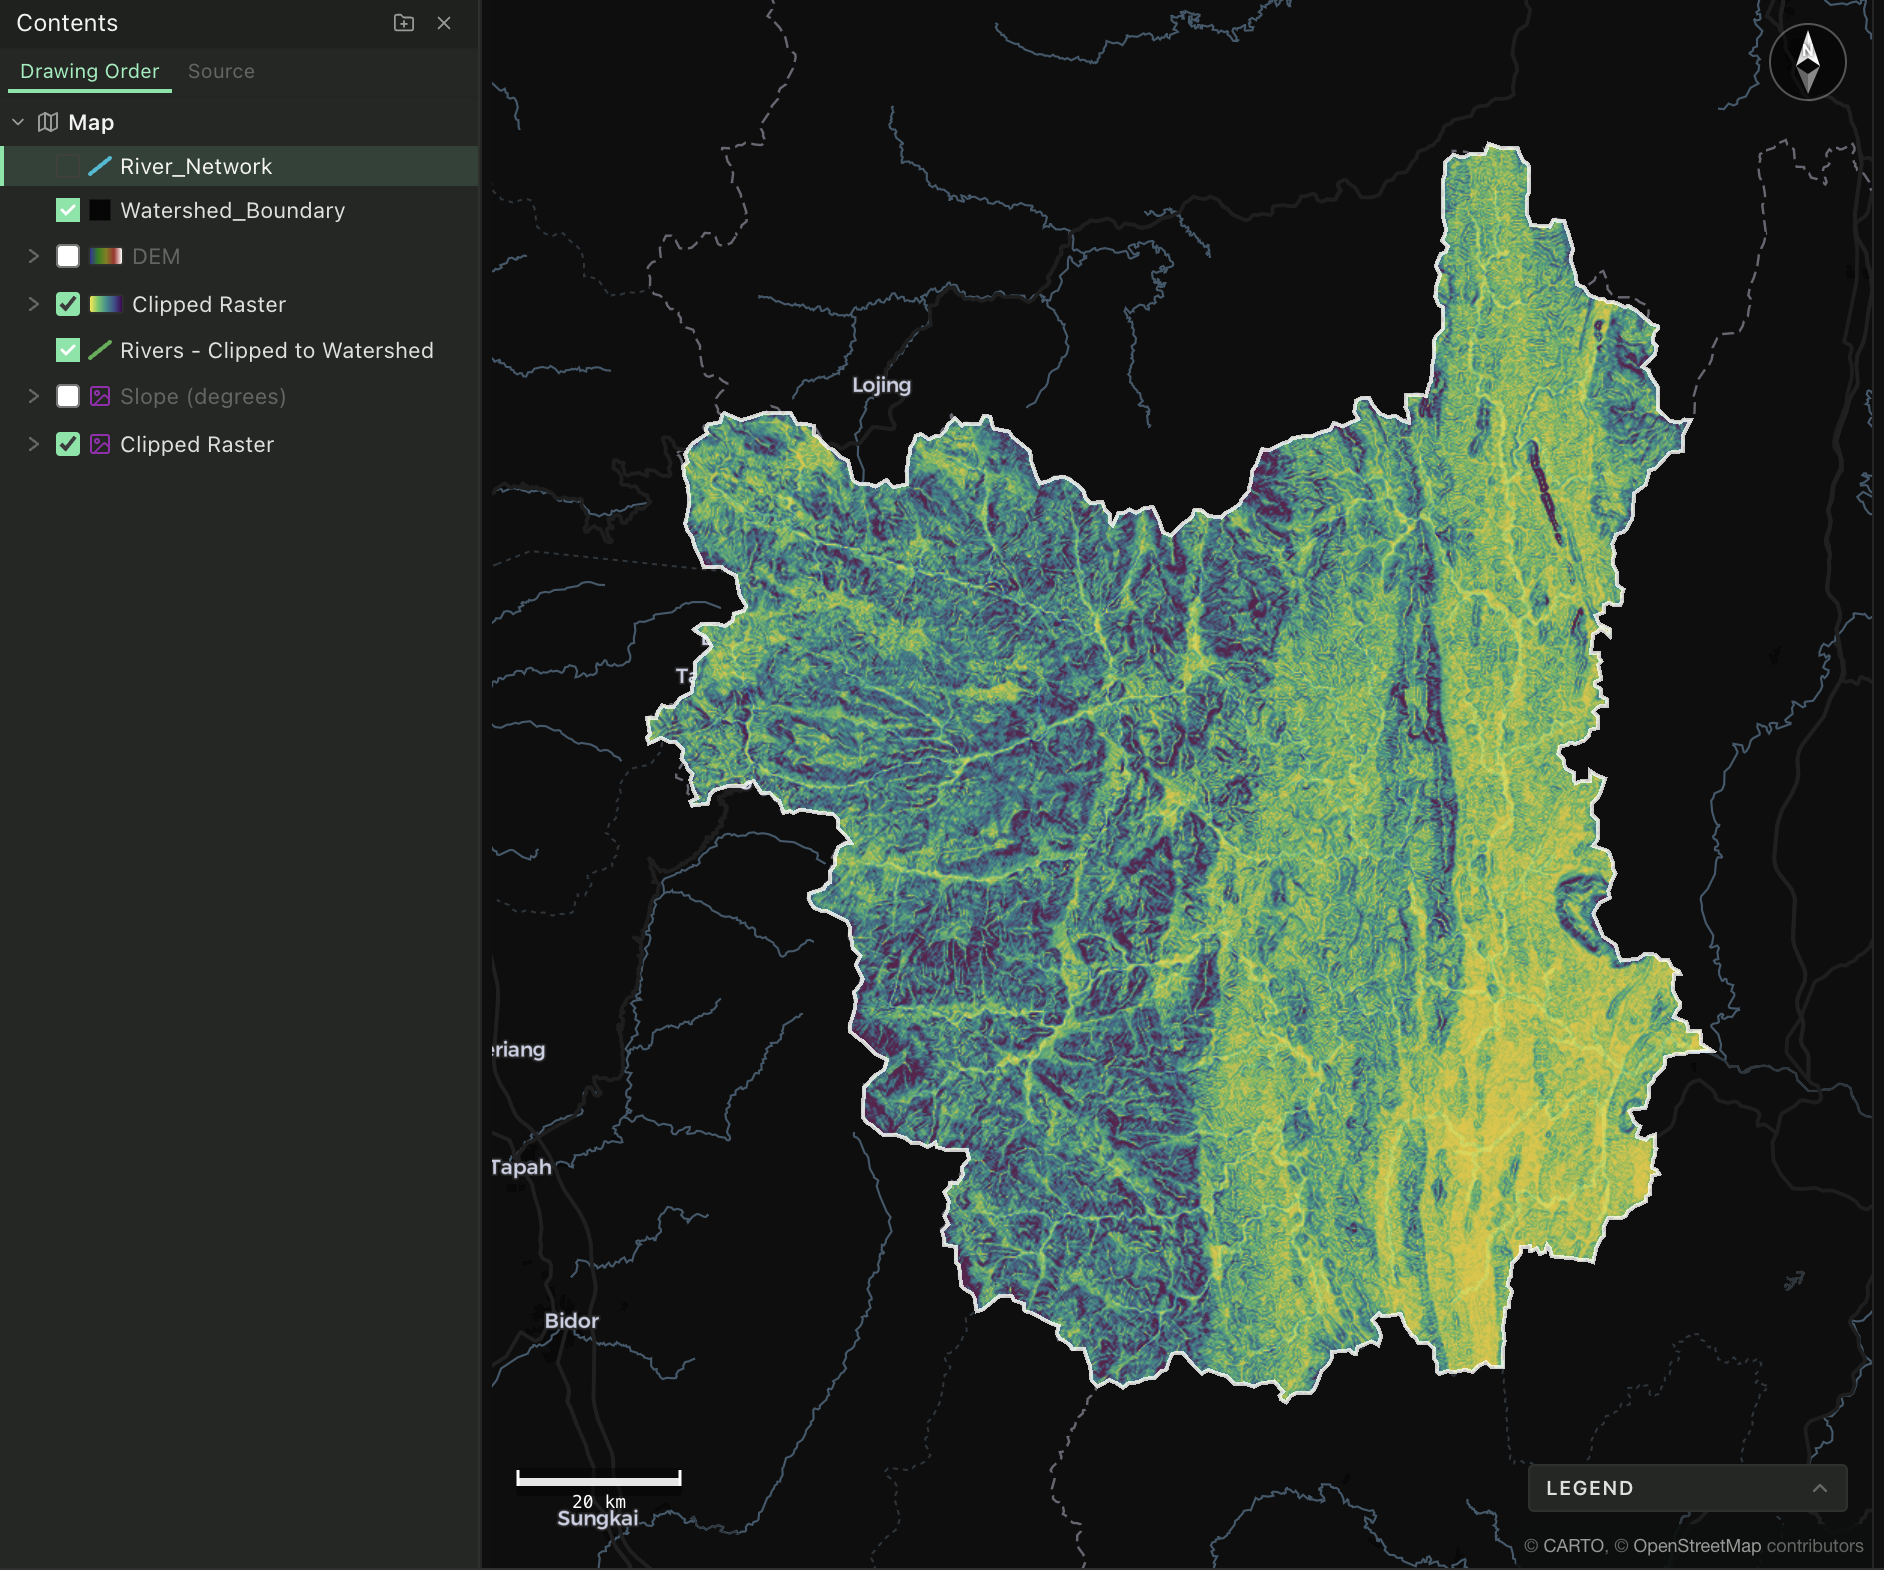
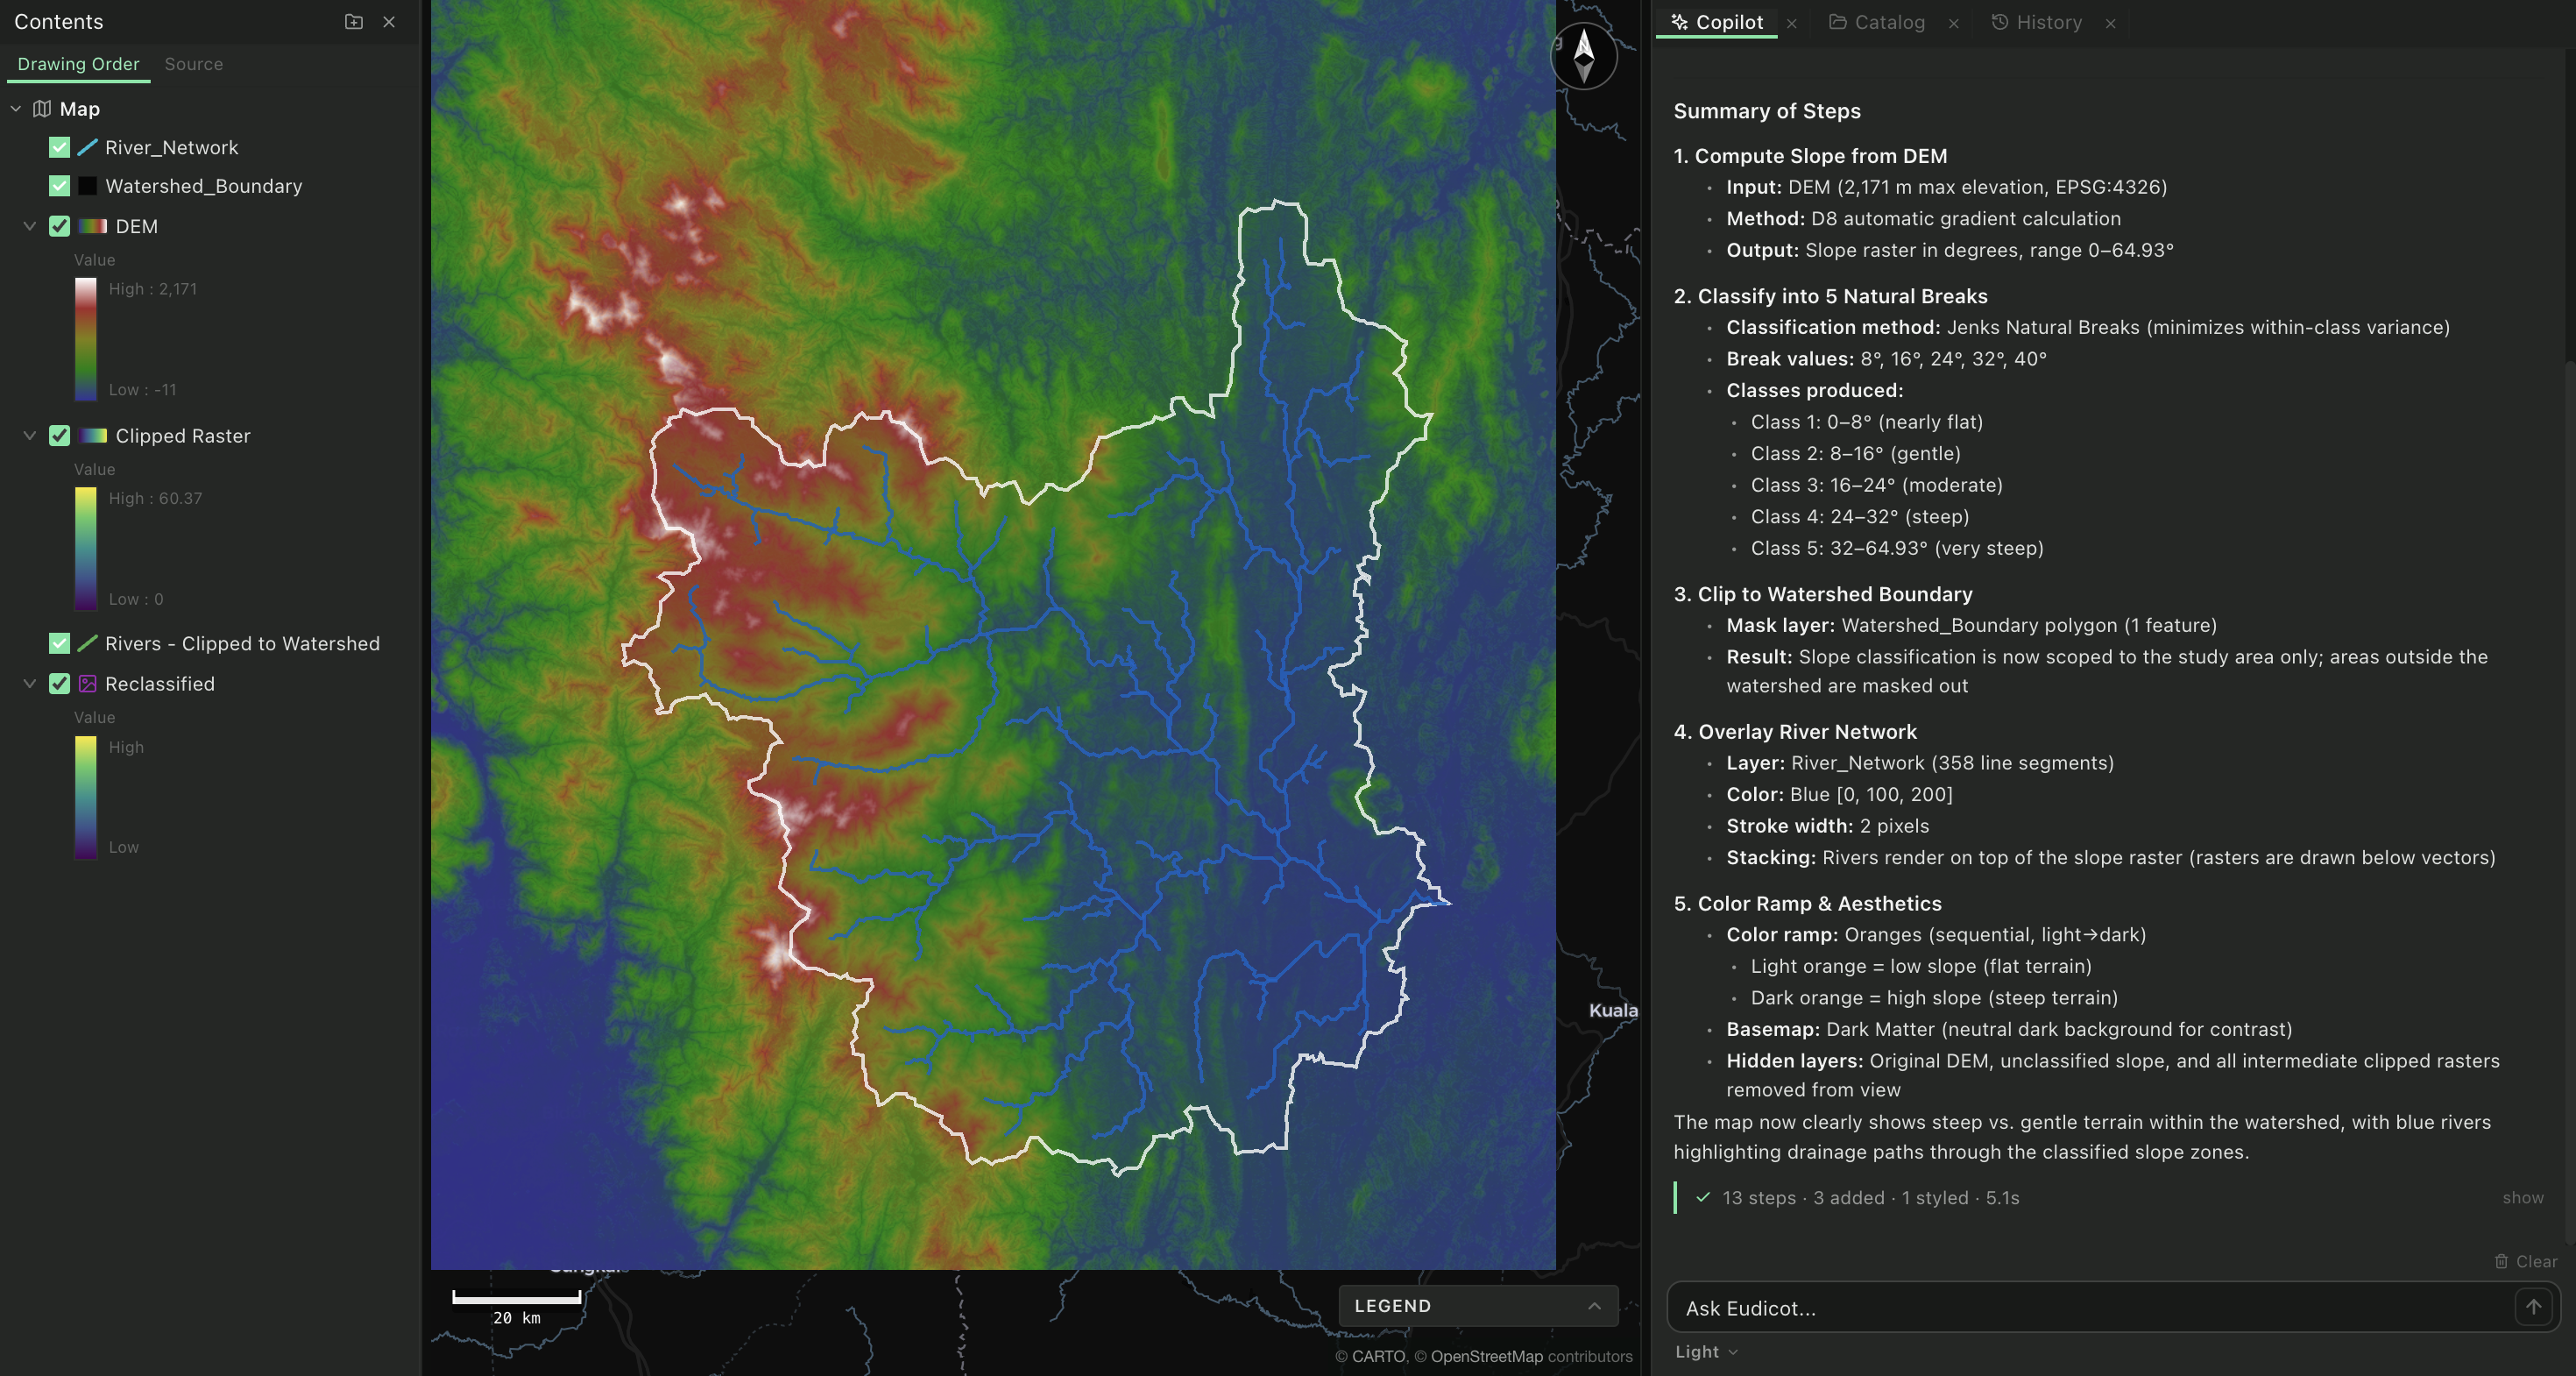
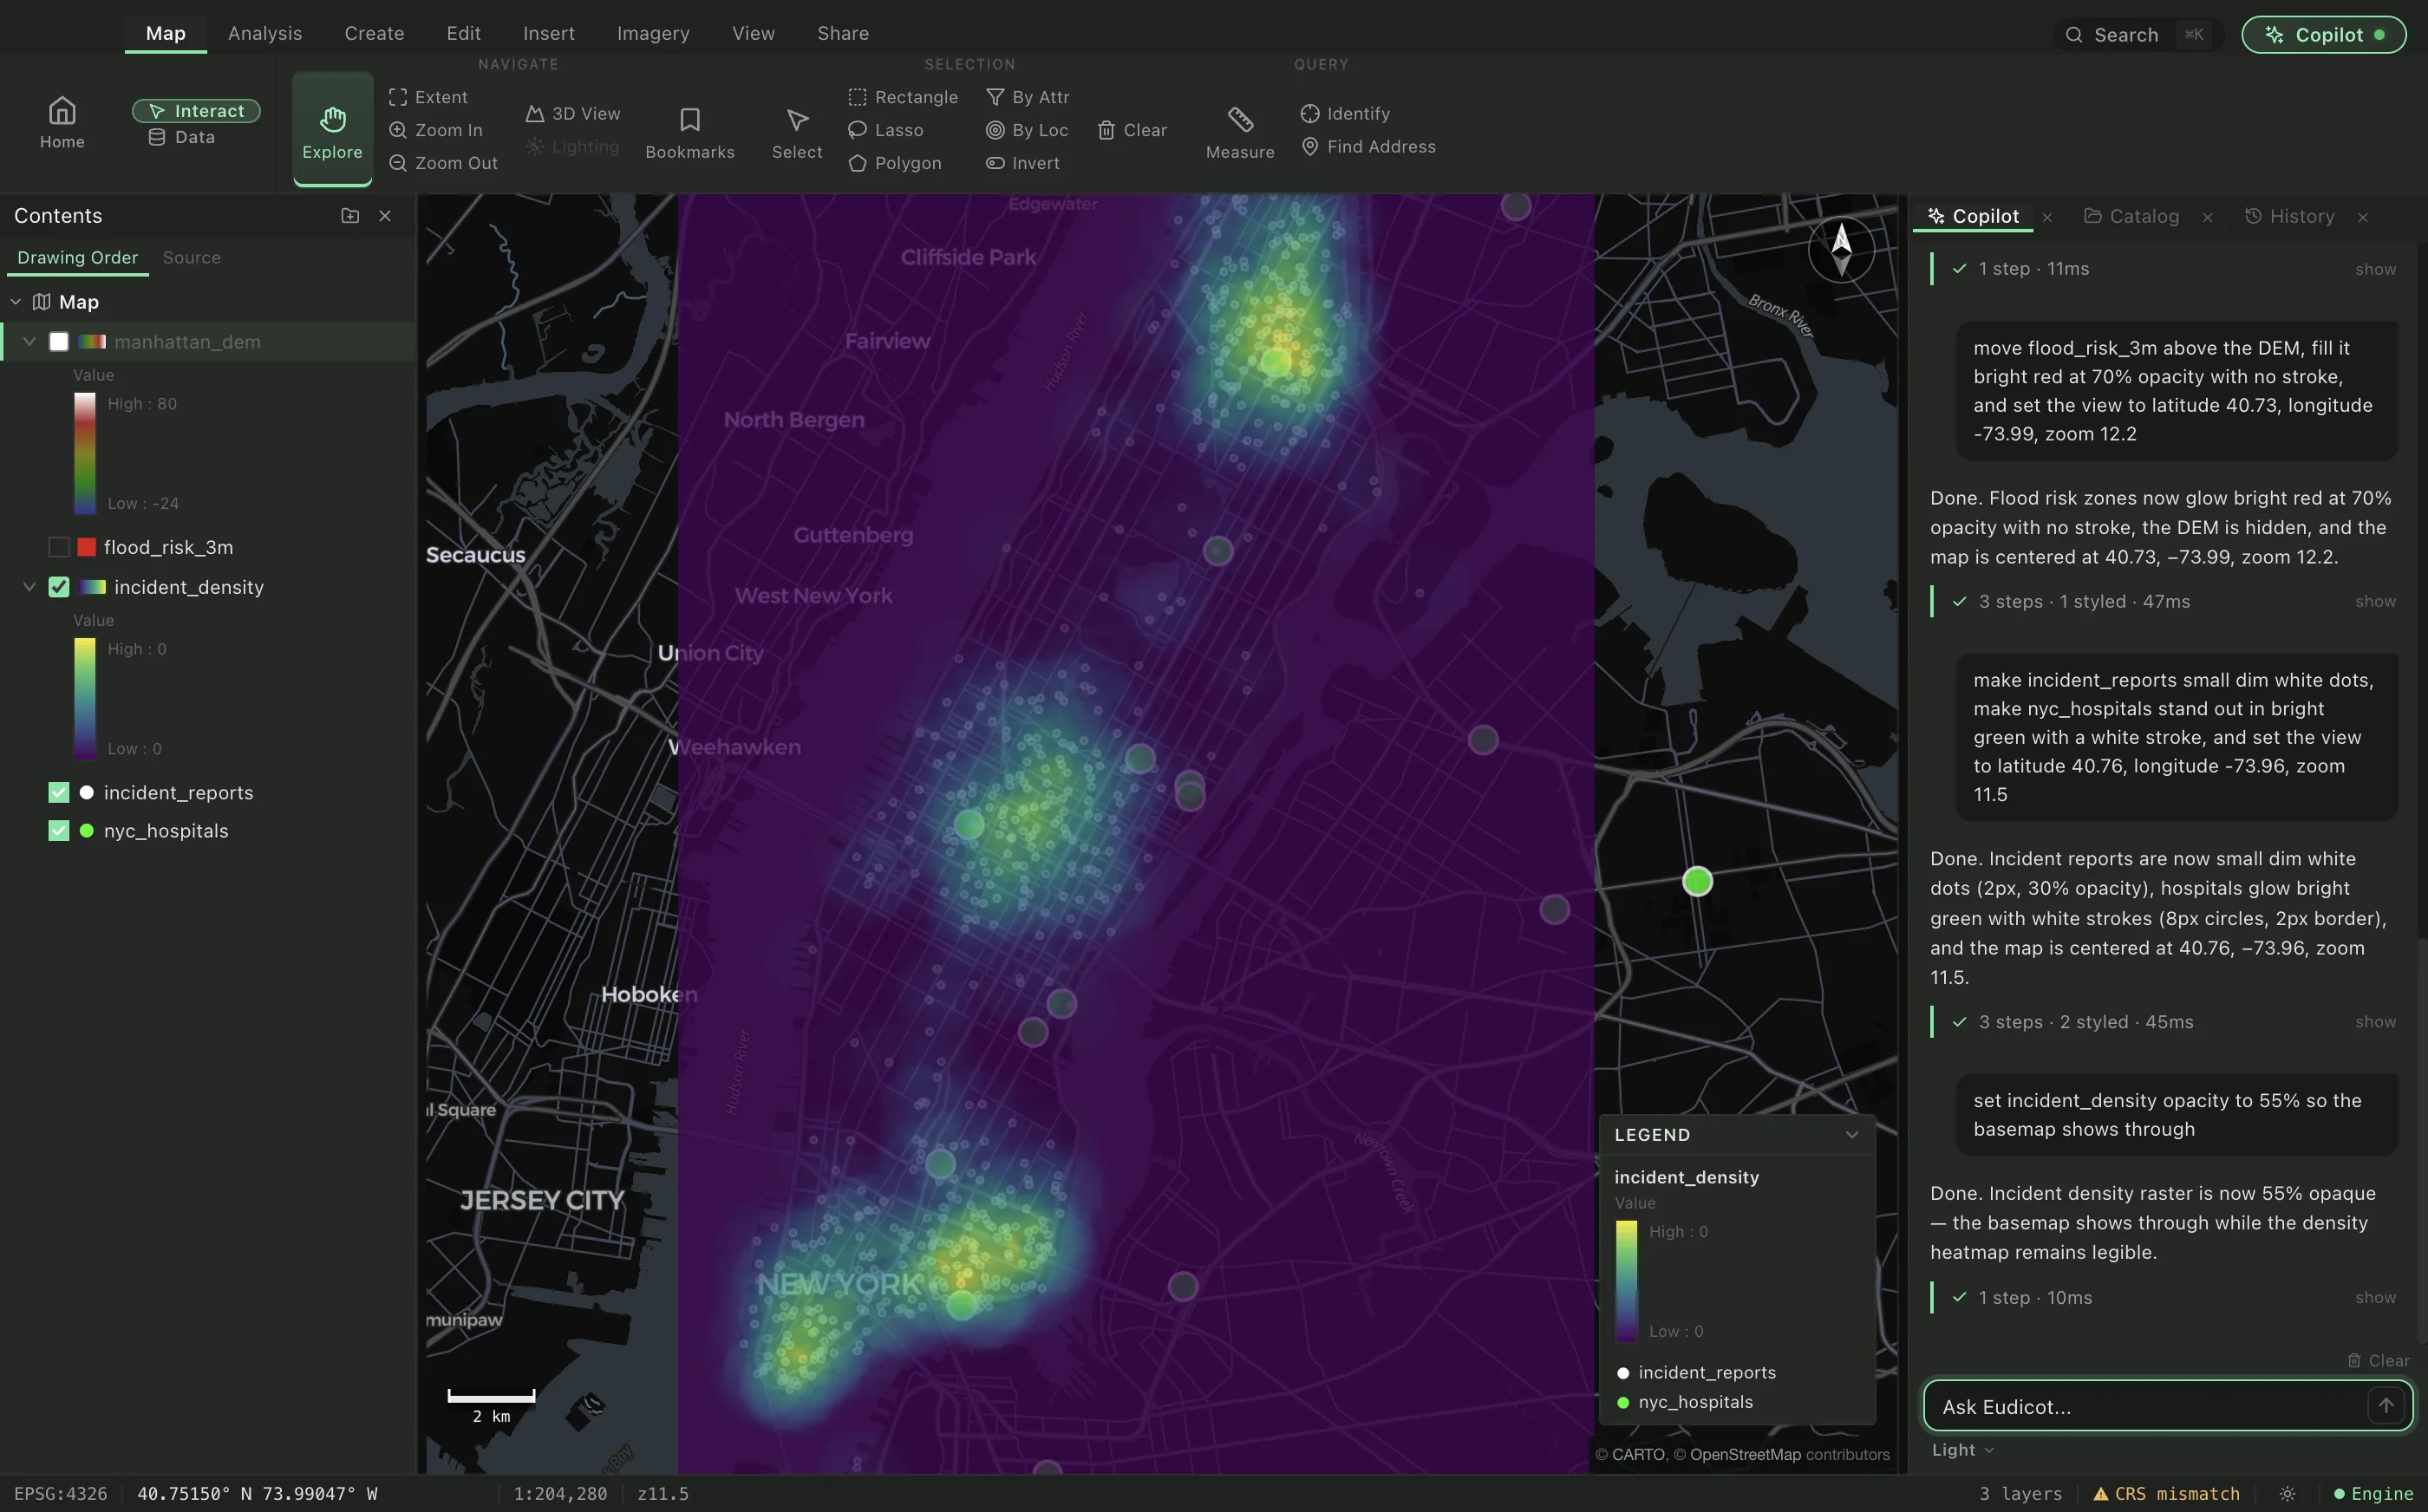
 Map interface with layered data
 Analyst reviewing spatial results
The AI that reads the map.
Every decision happens somewhere.
Ask in plain language. Get back living maps.
Geospatial intelligence, without the GIS degree.
What is Eudicot
/ˌyo͞o·ˈdī·kät/ noun
an AI-native geographic information system. It connects your data to a map and lets you create, analyze, and act on it through natural language. You describe the question; Eudicot does the spatial reasoning, the layering, and the analysis, and shows its work.
botany · a flowering plant that sprouts two seed leaves.
01
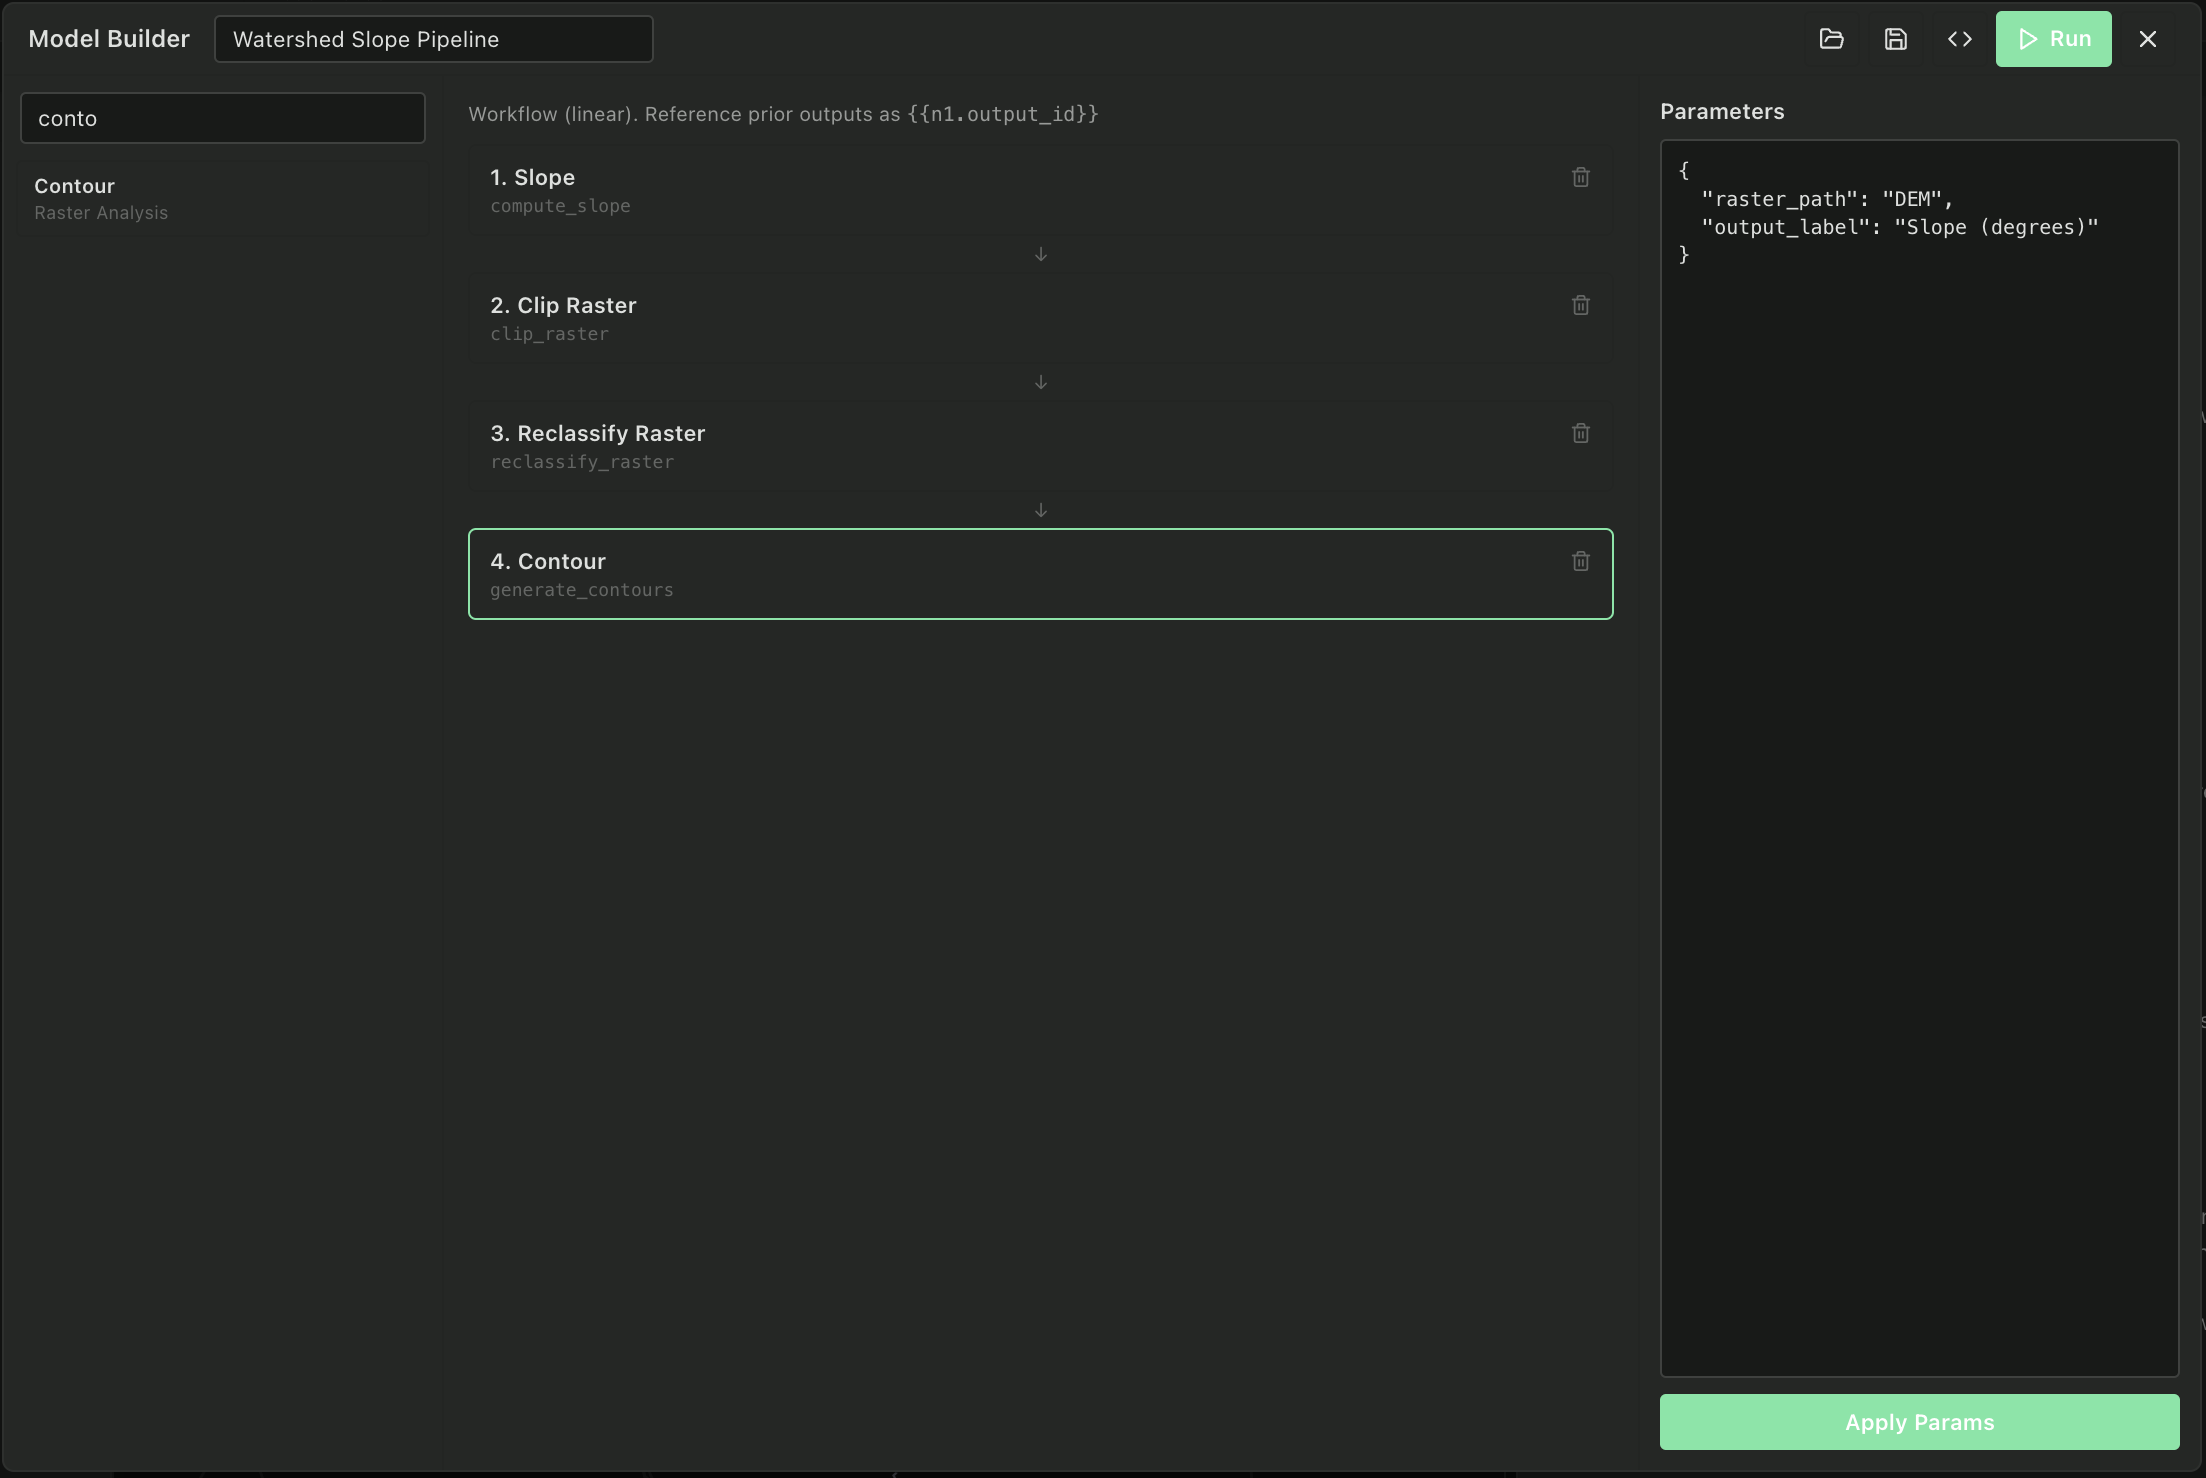
Natural-language queries that turn into real GIS operations: buffers, joins, suitability models, drive-time analysis. No toolbars required.
02
Connect business systems and authoritative sources so every map stays current and trustworthy.
03
Every answer comes with the layers, methods, and assumptions behind it, so you can verify and refine.
04
Turn a repeated question into a scheduled, monitored automation.
01
Weigh demographics, travel time, competition, and site suitability in one question.
02
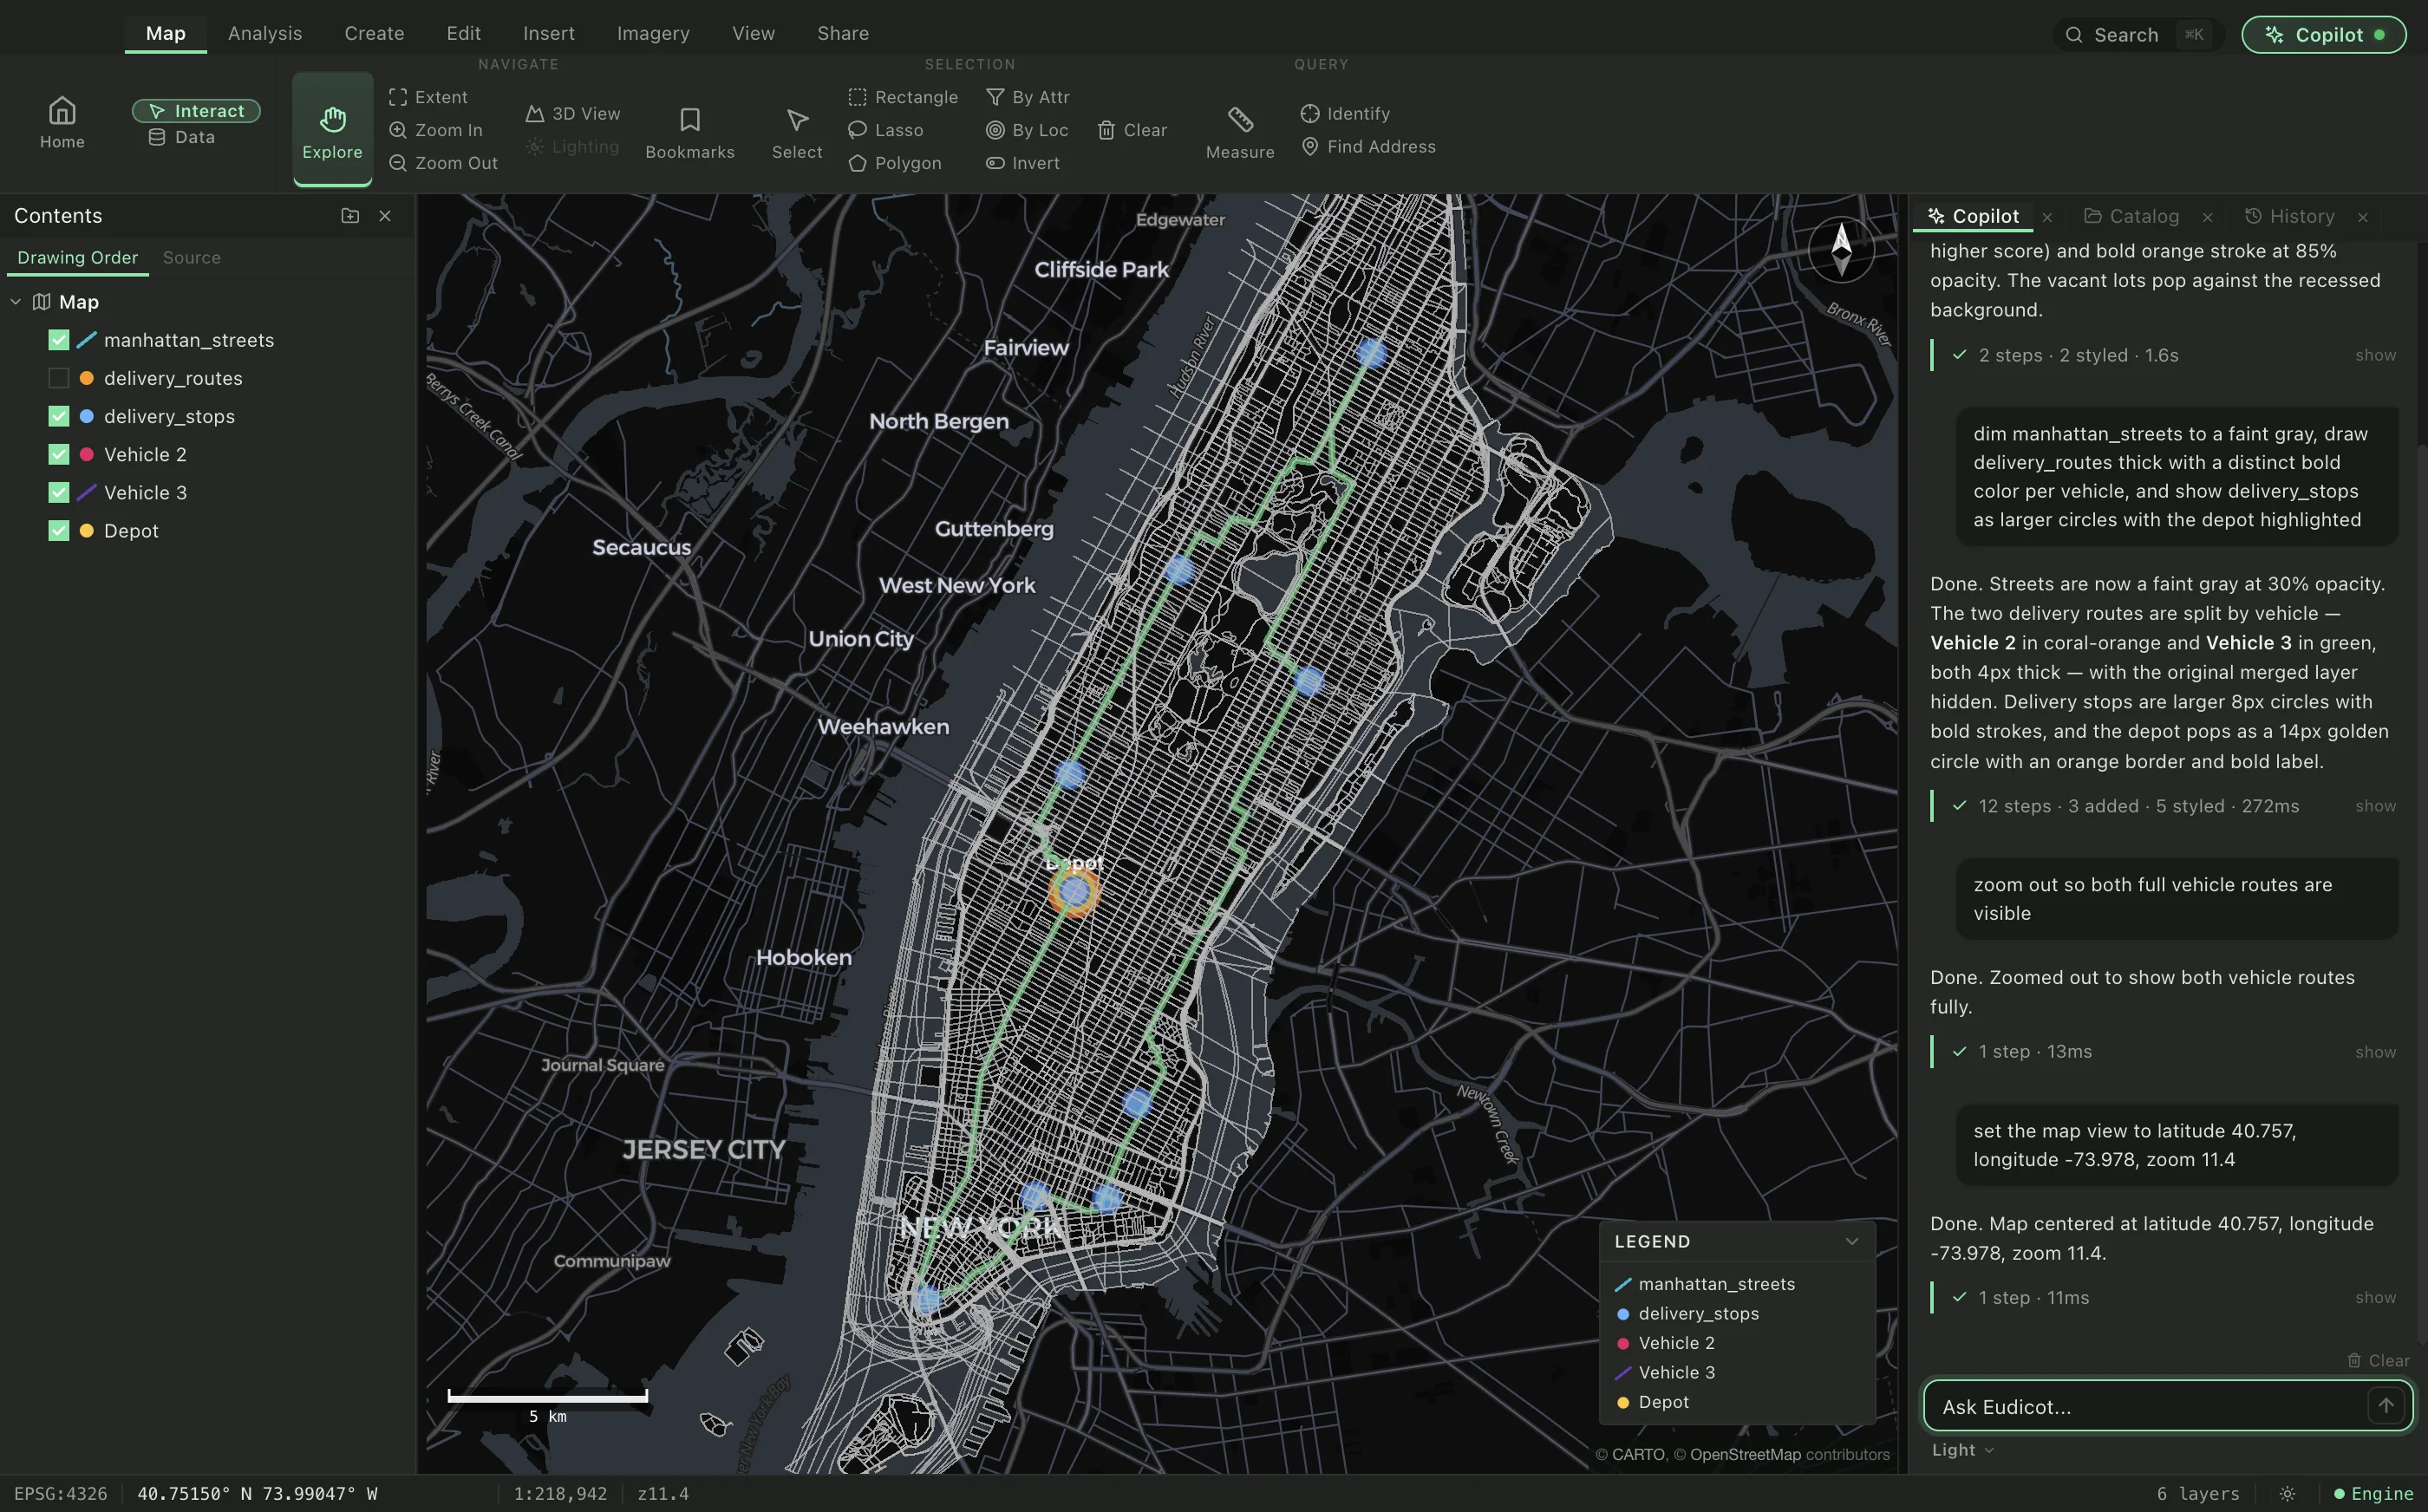
Optimize fleets and supply chains in real time, with constraints described in words.
03
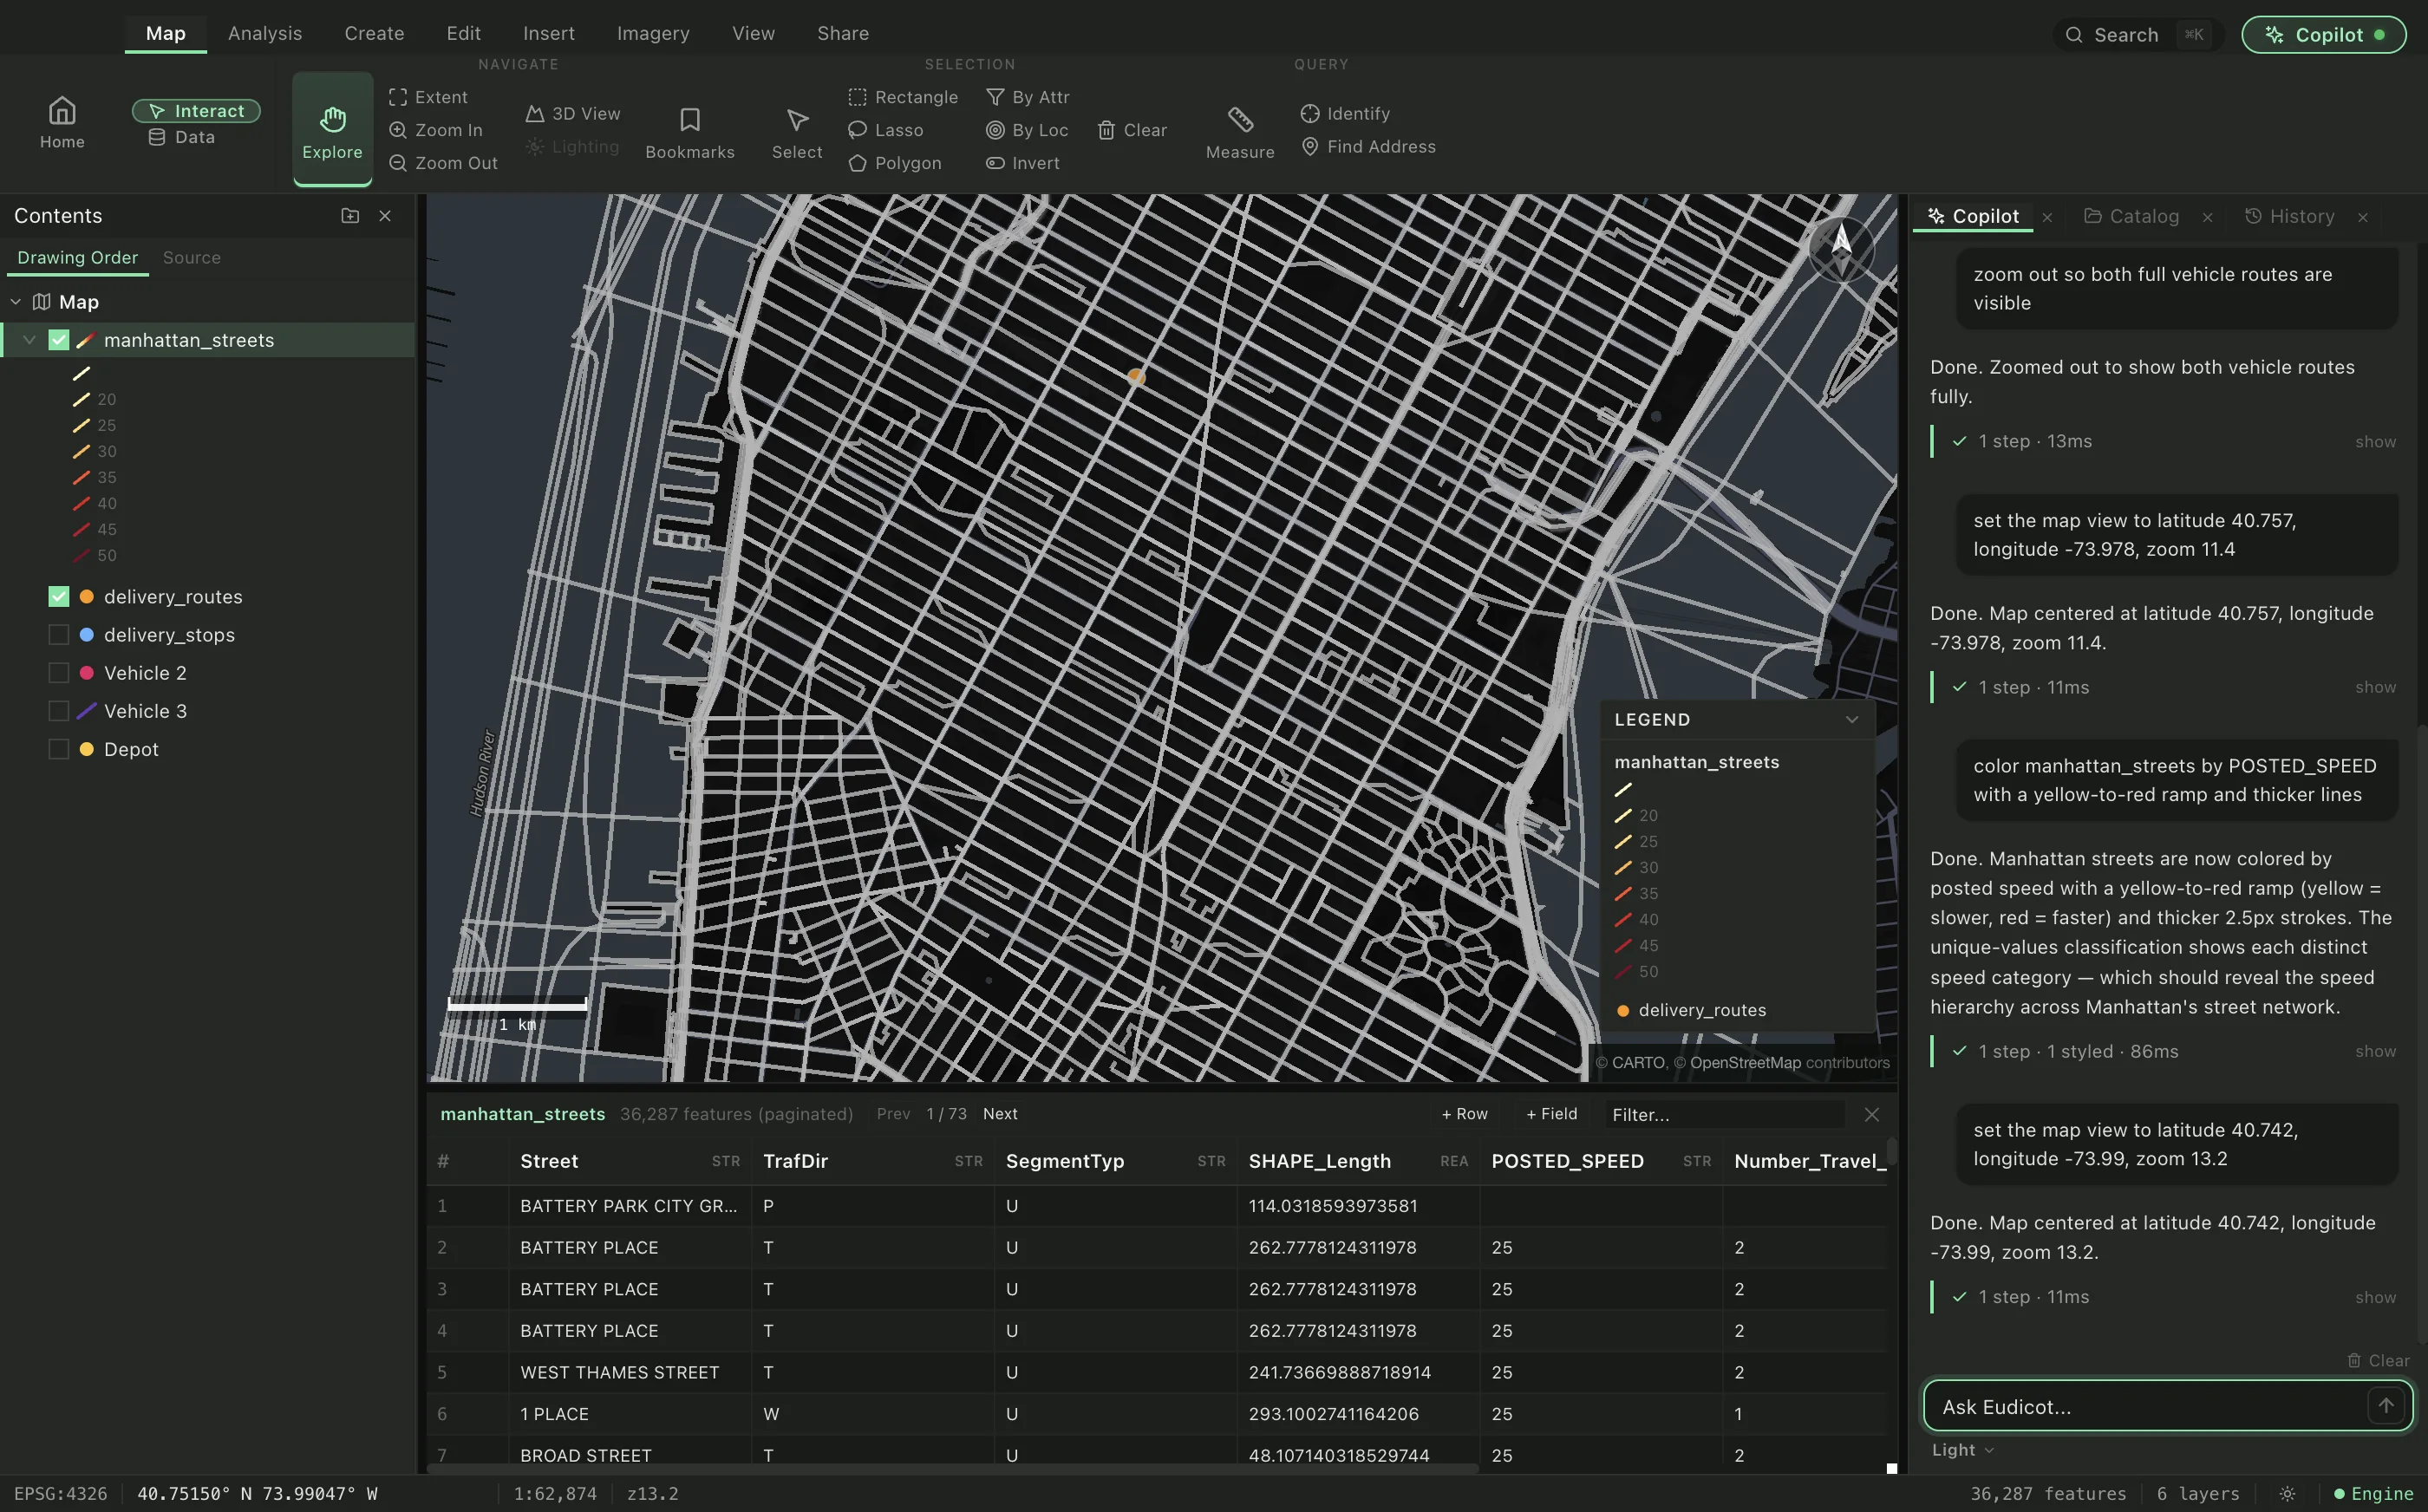
Pipes, poles, vehicles, vegetation: know where things are and what condition they're in.
04
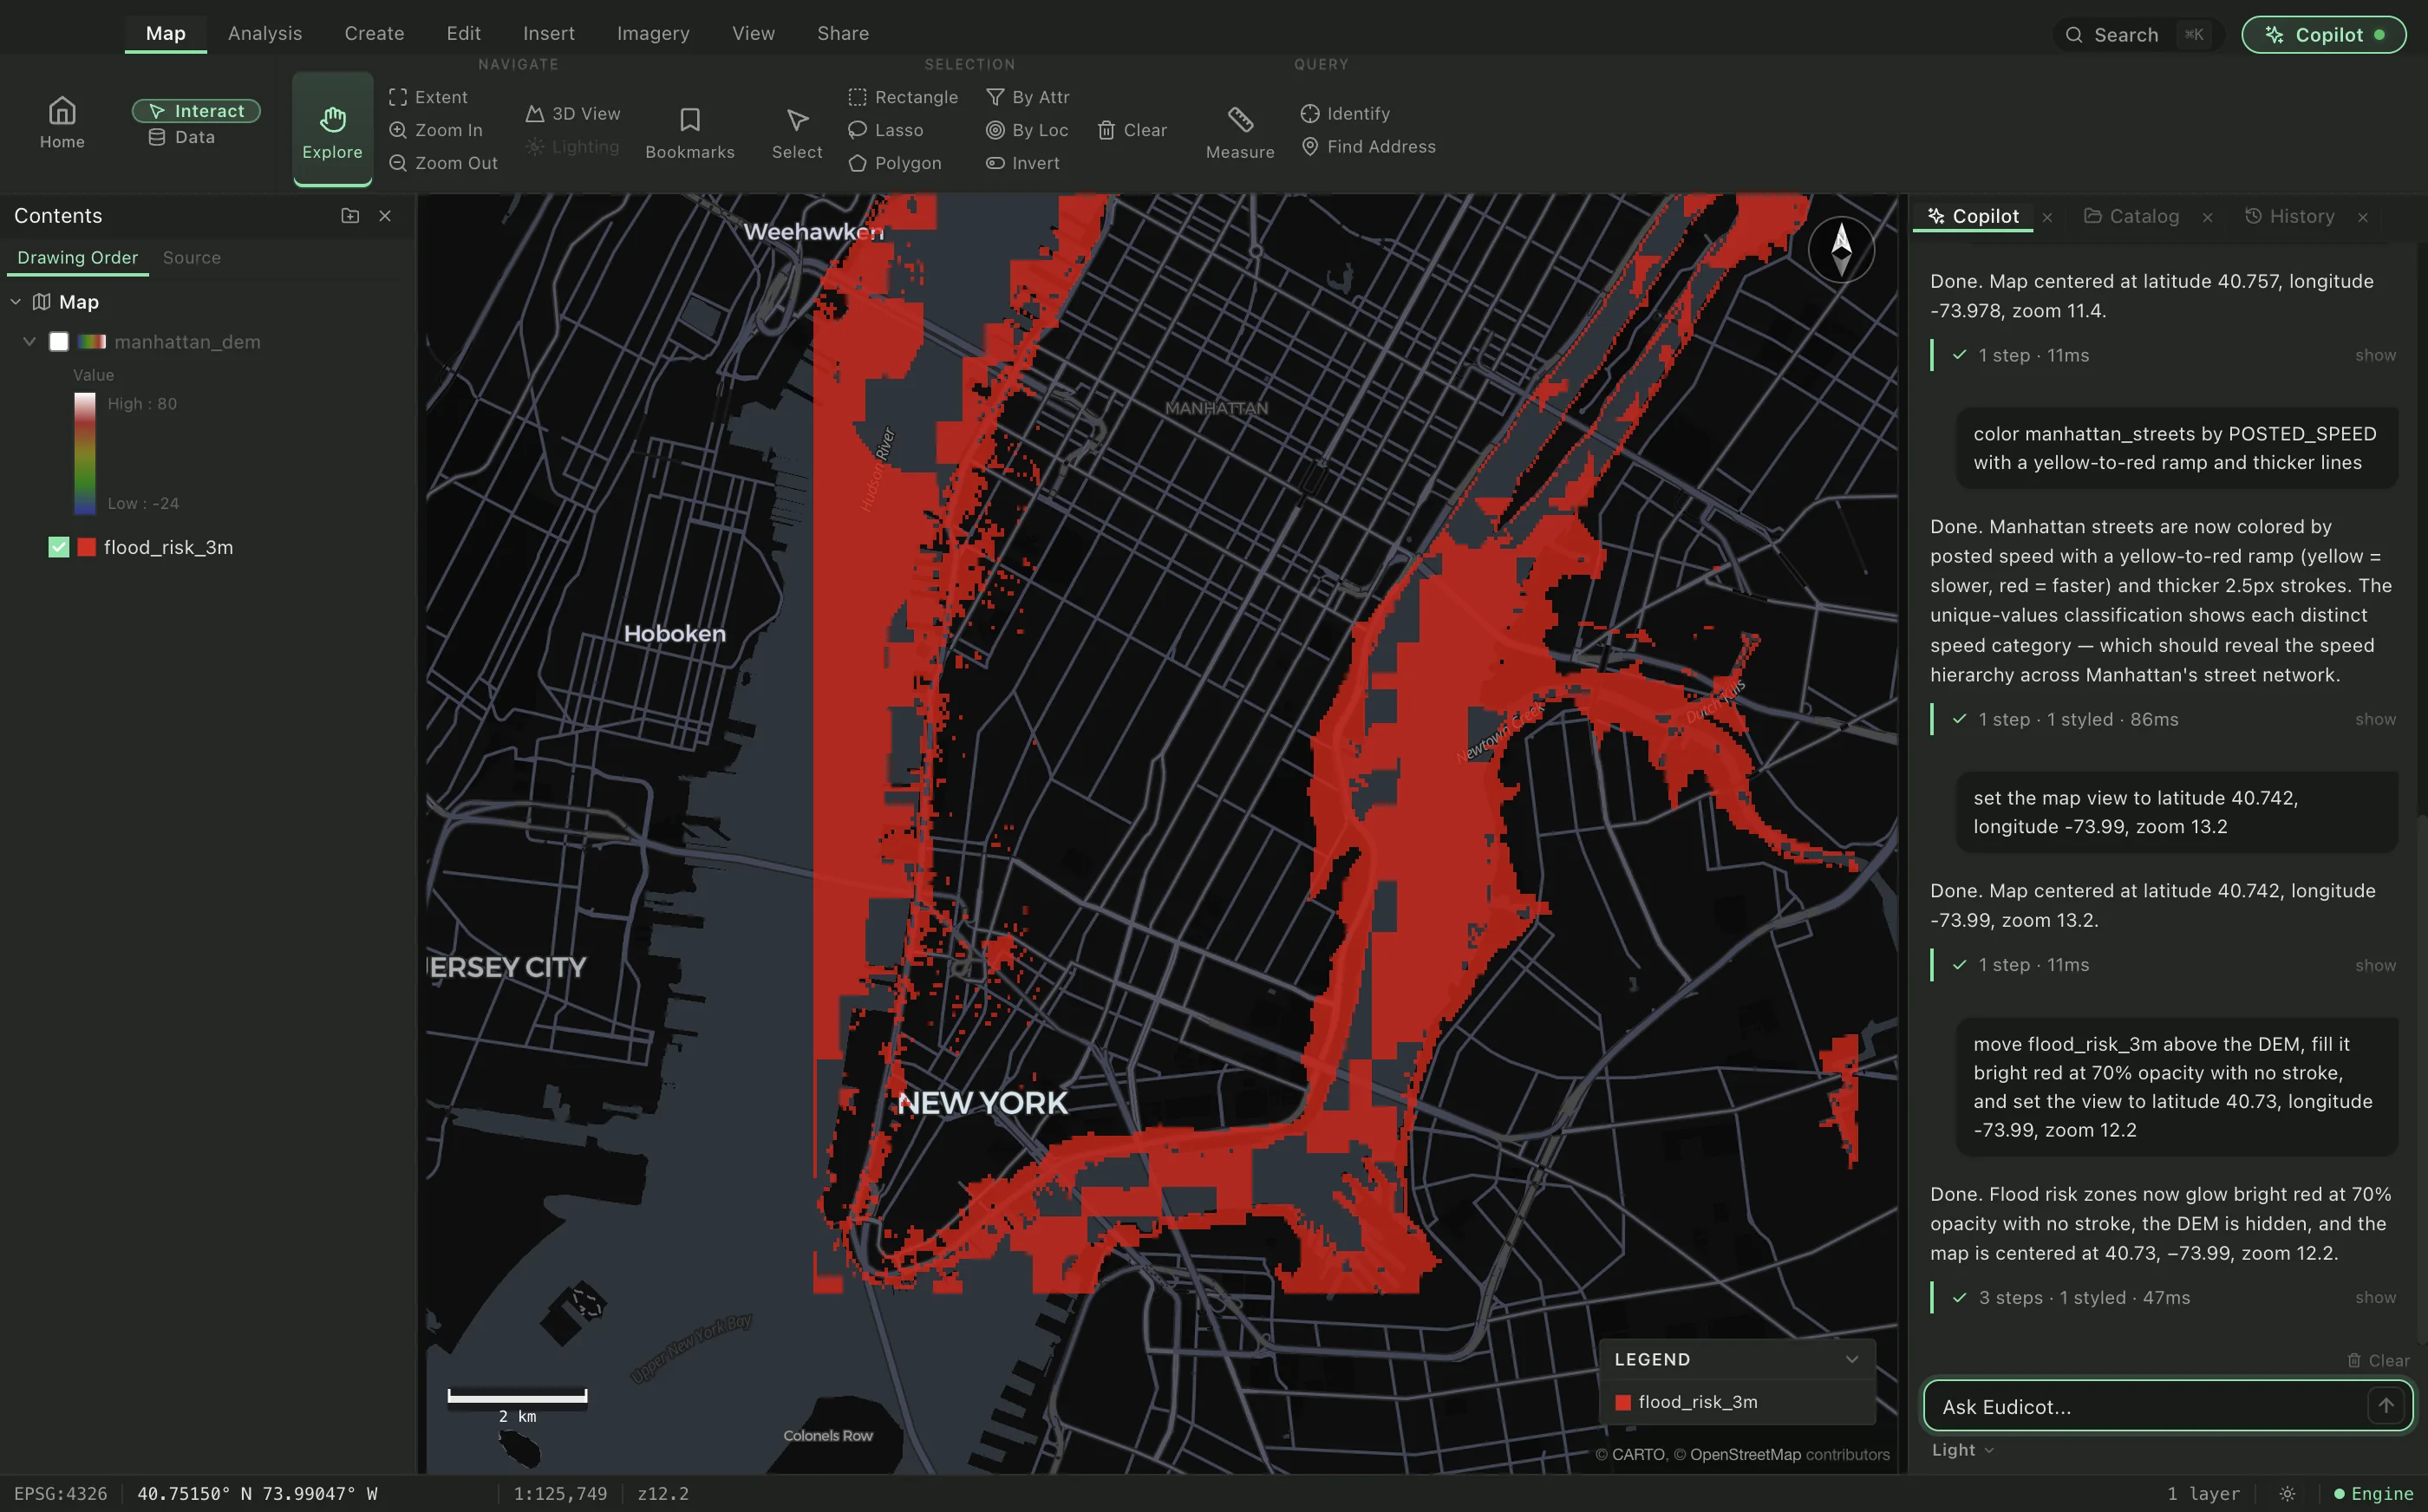
Model growth, climate, and risk scenarios before committing budget.
05
See what's happening, where, right now, and direct help to where it's needed most.
This is a live map: 310 Manhattan census tracts, classified by the same engine the app ships. It tours the schemes on its own. Touch anything and it's yours.
Median household income, 5 classes
Breaks from mapclassify, buffers from GeoPandas, hot spots from esda. The same libraries the app runs on your machine. Nothing here is hand drawn.
The hardest problems are inseparable from where they happen. Eudicot makes that geography answerable.
For macOS and Windows.